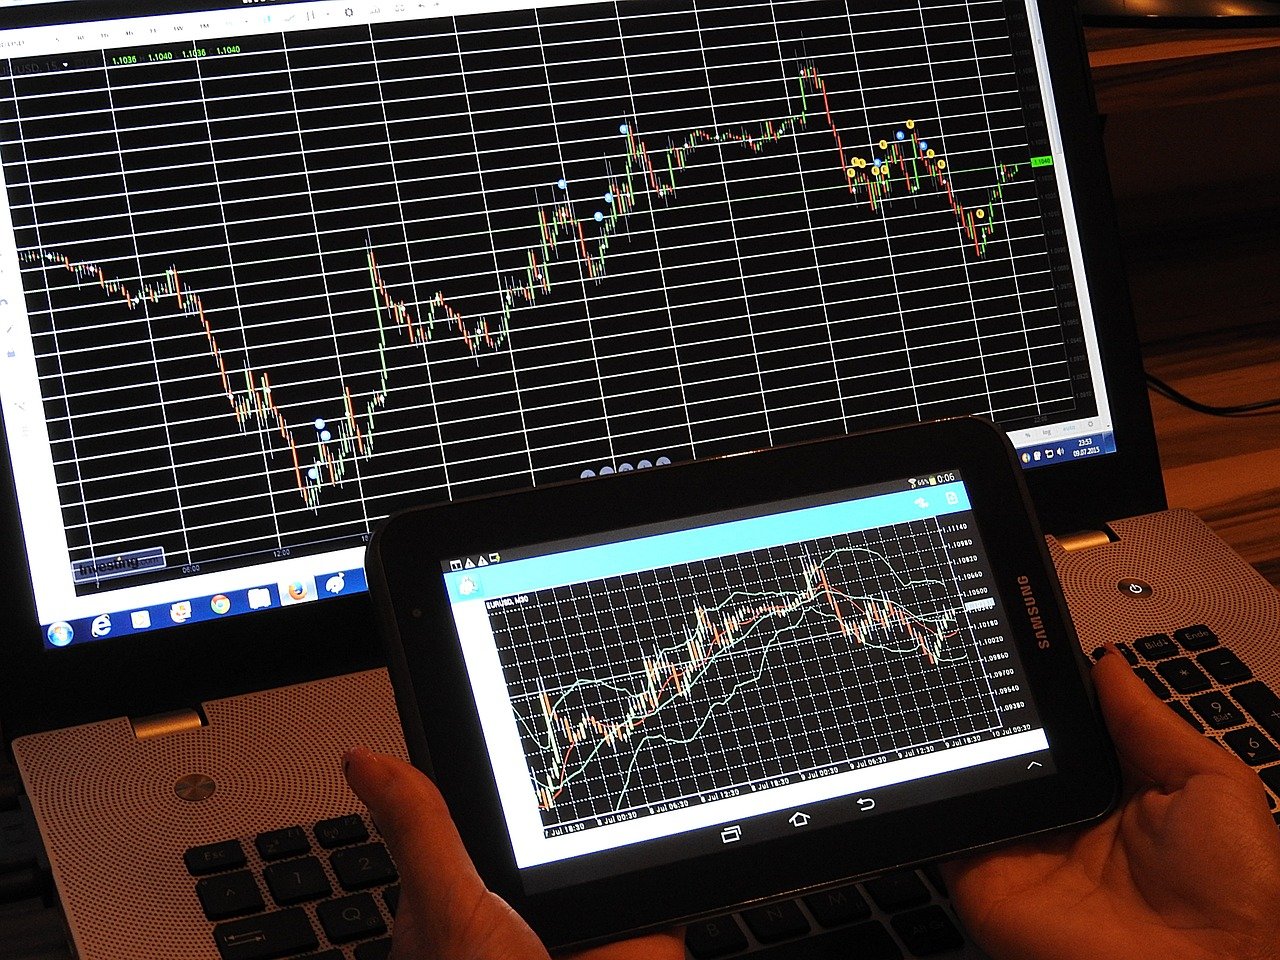
Just as an aspiring author reads the classics to educate himself on the legacy of literature that came before him, a trader must also familiarise himself with forex strategies and forex market analysis in order to enter the markets with a solid base of knowledge and understanding. Before you embark on a journey toward CFD trading, it’s essential to read up on the strategies used by others so you can decide which of them to make your own.
Trading strategies don’t assure a trader of success, and it’s only through experience that he knows which one to employ. Rather, what they do offer to a studious trader is a potential window to the future price movements of a trading instrument or currency pair that may help him or her make more informed trading decisions. If you’re involved in CFD and/or forex trading with iFOREX, let’s touch on three of the most useful techniques around.
Breakout Strategy
Forex strategies offer different types of windows to potential future price movements, and the one you use at a given time should suit your particular trading needs. For example, a young trader and a seasoned trader will probably have different goals and risk thresholds. The latter, wanting to minimise risk, may spend time analysing the fundamentals of the companies with which he trades.
The former might be more interested in holding short-term positions and be willing to risk a larger portion of his funds, therefore focusing on more technical aspects of strategy. The first technique we’ll look at is fairly well-trodden and starts with a triangle.
When you notice that the up-and-down fluctuations of your asset’s prices tend to get less and less pronounced – the highs reaching less and less high, and the lows dropping less and less low – you will see that the hint of a triangle forms on your chart. Draw a line connecting the lower upswings, and another connecting the higher downswings, and your triangle appears.
If the price is now beginning to break out above the upper trendline, this may be an indication that prices are starting a new upward trend beyond their previous confines. This, some traders believe, may be a good time to open a “buy” deal. Take note that sometimes events may not turn out as you expect – which is called a false breakout – but that doesn’t mean the rule never applies.
Candlestick Patterns
Forex market analysis can be done a shade more accurately. When you look at a candlestick chart, you’re seeing convenient representations of what happened in a sequence of time-periods, which could be five-minute periods, fifteen-minute periods, or even one-hour periods. If the candlestick is coloured black, it means the closing price for the period was lower than the opening price.
If it is white, the price closed higher than it opened. The followers of this popular forex market analysis strategy study the chart patterns which have been recognized and named by the experts, and then they search for them in their price chart of choice. If one of them appears there, it may be a clue to potential future price movements.
A well-known example is the Three Line Strike pattern. Three successive black candles descend, each ending lower than the previous one. The fourth candle starts even lower than the third but extends all the way up above the starting point of the first. The white colour of this candle shows that prices successfully made big gains for the period. According to some theorists, there is an 83% chance prices will continue to progress bullishly after this. However, remember that such indications are only meant for insight, and not a guarantee.
Stop-Loss Orders
Stop-loss orders are considered more of a risk mitigation tool, however they can play a key role in many traders’ forex strategies. These can be tremendously useful because they familiarize you in establishing how much money you are willing to risk losing on each trade, and they put limits on the size of the position you decide to open. As a guideline, many skilled traders put less than 1% of their account balance on the line for any given trade.
A general calculation that may help you decide at which levels to set your stop-loss order is as follows: first take the difference between your entry price (let’s say $10) and your stop-loss price (let’s say $9.75), which would be $0.25. This is the amount per-share that you’re willing to risk losing. Divide $300 by 0.25 and you get 1200, which is the maximum amount of share CFDs which you could put up in one deal. The key to getting stop-loss orders “right,” however, lies in experience.
Wrapping Up
Commit yourself to continuously reading up on trading strategies and slowly expanding your knowledge. Your forex market analysis should extend beyond studying charts and also include keeping in touch with market news quite frequently, as well as with relevant events in the political or economic world like interest rate hikes and product launches. Finally, the golden rule of CFD trading is never to be led on by the heat of emotion. Follow your strategy to the end every time and then take stock afterward so you can gain a bit of insight with each trade.

